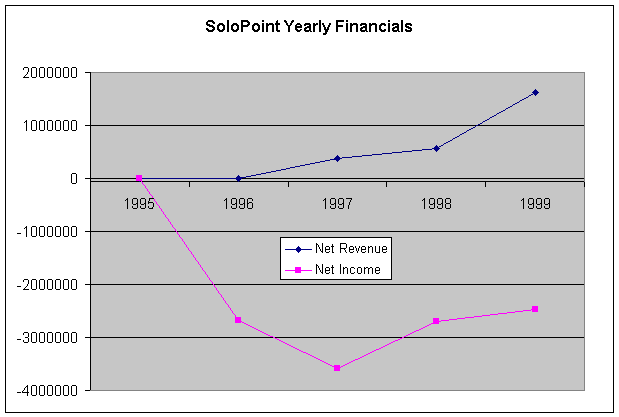
Yearly Financials - Chart
Yearly Financials - Spreadsheet
Quarterly Financials - Chart
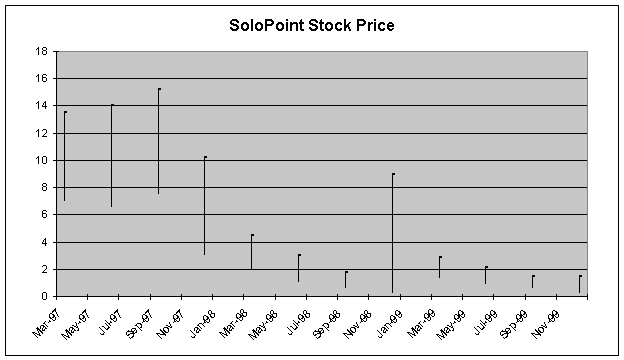
High/Low Stock Price - Chart
(top of page)
Home | About | Companies | Boards | Editorials | Contact Us | Sitemap
Legal Notice Website design: AGC Group